


Business Intelligence Consultant and data cruncher Maureen O'Donnell from business consultant firm Interworks recently published an interesting exploration of publicly accessible data on New York City traffic incidents across all 5 boroughs.
After analysis of all the data, she compiled a few interactive slides and visualizations of the data, leading to the following takeaways:
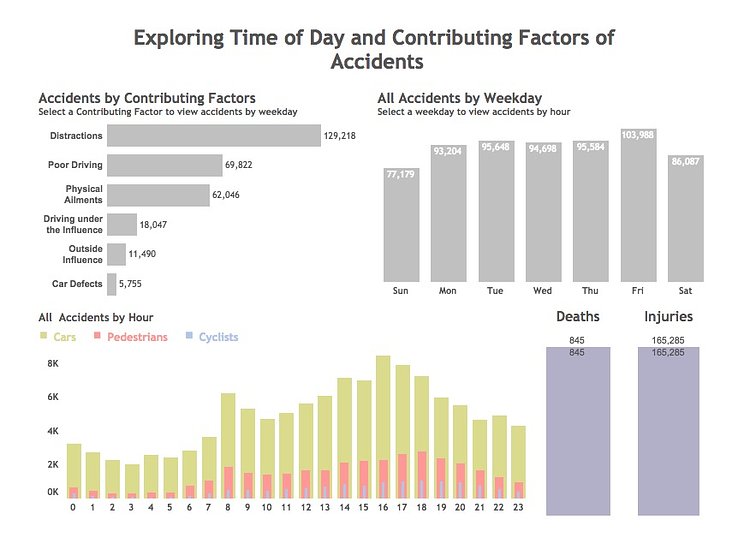
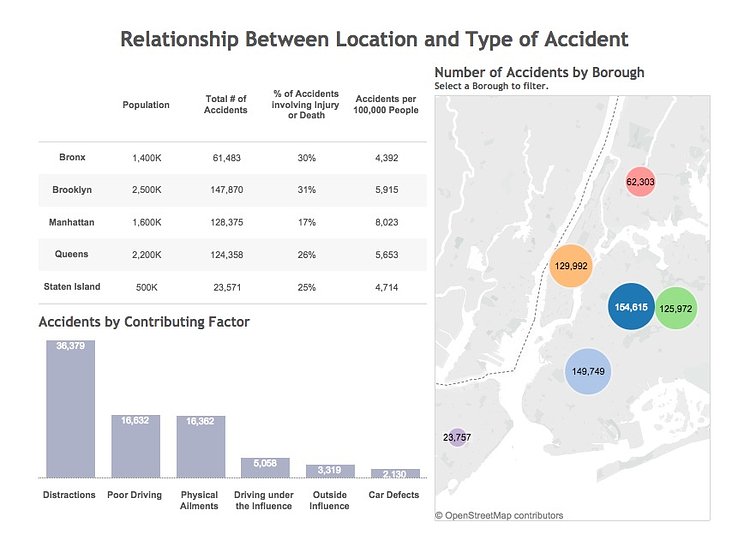
- Total Number of Accidents: 638,280
- 26% of those accidents involved injury or death - Brooklyn had the highest number of accidents with 147,870 - Manhattan had the highest per capita accidents with 8,023 accidents per 100,000 people
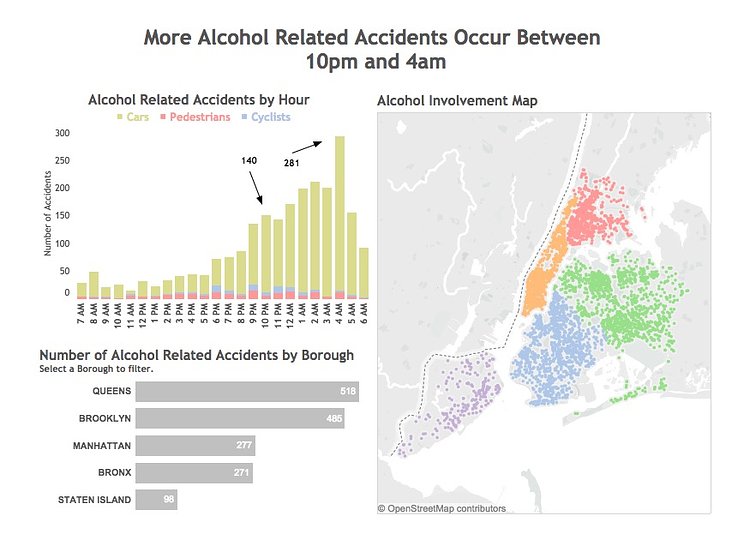
Check out the interactive tableau here.
via Interworks

Matt Coneybeare
Editor in Chief
Matt enjoys exploring the City's with his partner and son. He is an avid marathon runner, and spends most of his time eating, running, and working on cool stuff.
Something wrong with this post? Let us know!


