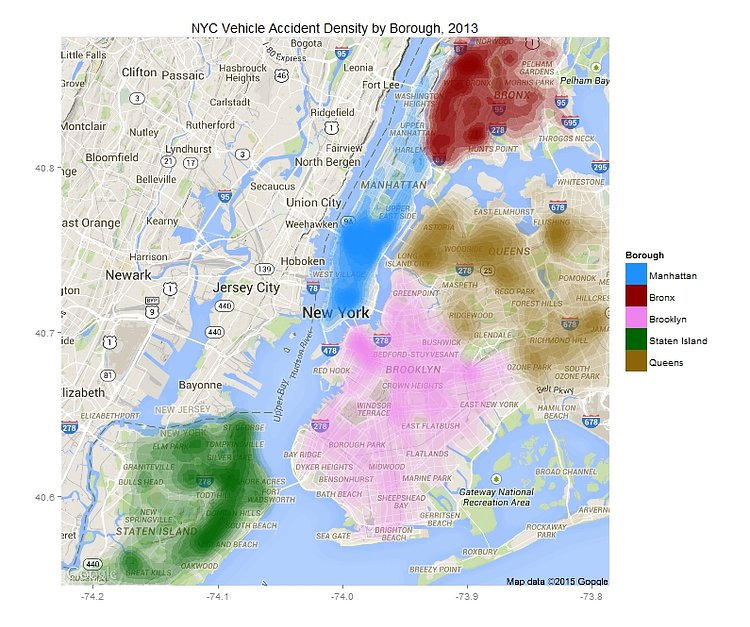
Stable Markets is, amongst other things, a data visualization blog that creates interesting new ways to view City data. A recent post by "Benevolent Planner" took data from NYC's Open Data project and uses it to create a heat map of traffic accident reports, broken down by borough.
The data comes from NYC Open Data. My data cut ranges from 2012 to 2015. The data tracks the type of vehicle, the name of the street on which the accident occurs, as well as the longitude and latitude coordinates of the accident.
via Stable Markets

Matt Coneybeare
Editor in Chief
Matt enjoys exploring the City's with his partner and son. He is an avid marathon runner, and spends most of his time eating, running, and working on cool stuff.
Something wrong with this post? Let us know!


