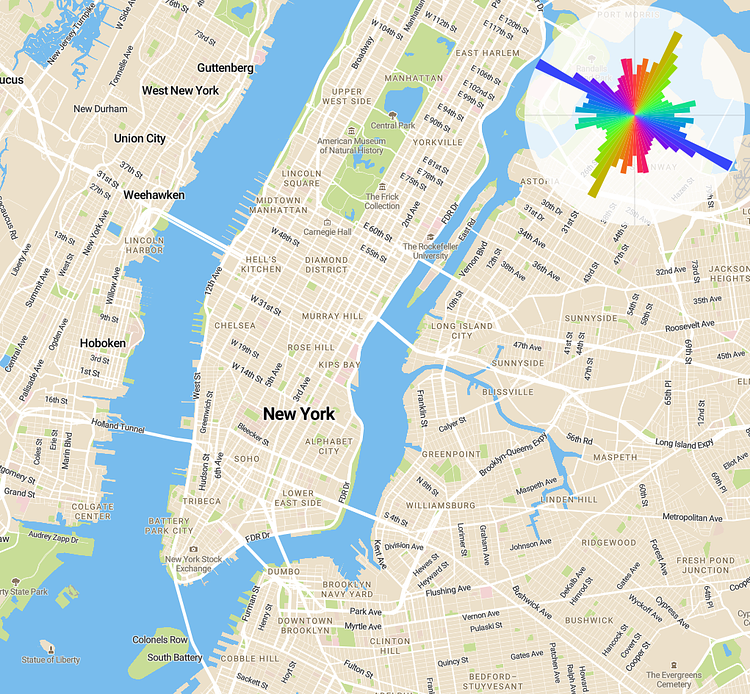
Mapbox engineer and data scientist Vladimir Agafonkin recently created this interesting interactive map which allows you to see the graph of how each street is oriented in the current map view. This means that for each street running north/south, a tick would be placed on the north/south radial display. East/west streets get a tick on the east and west sides. As you would expect, the graph over Manhattan's street grid is mostly in two directions, however, even though we conceptually visualize the grid as north/south/east/west in our heads, the islands northeast tilt means the graph actually shows something different. Check out the full map to play around with it in New York City, or other areas around the world
via Mapbox

Matt Coneybeare
Editor in Chief
Matt enjoys exploring the City's with his partner and son. He is an avid marathon runner, and spends most of his time eating, running, and working on cool stuff.
Something wrong with this post? Let us know!


