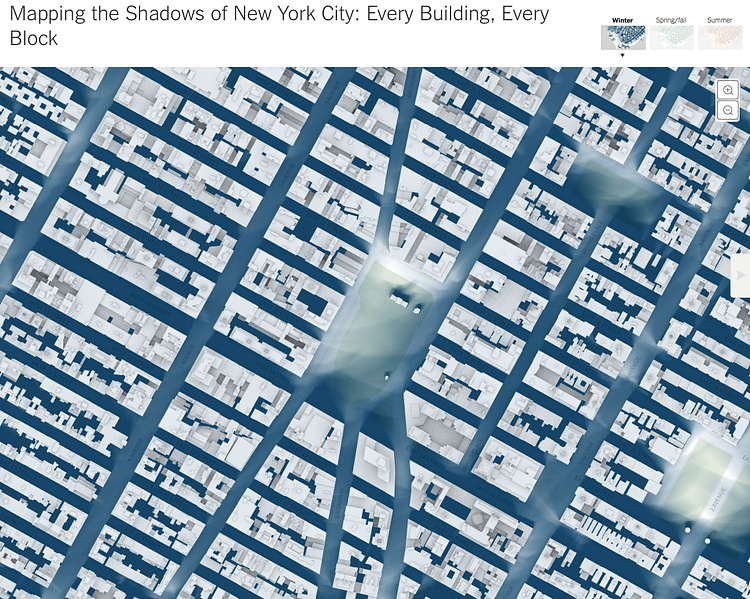
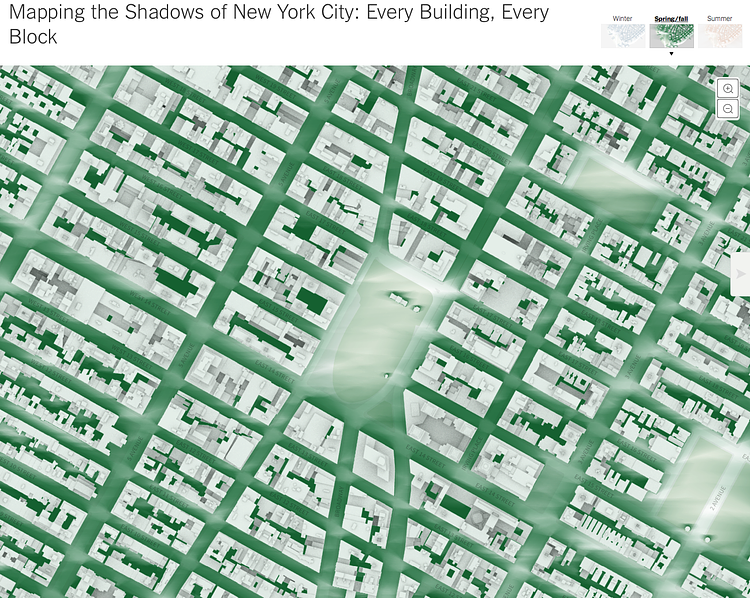
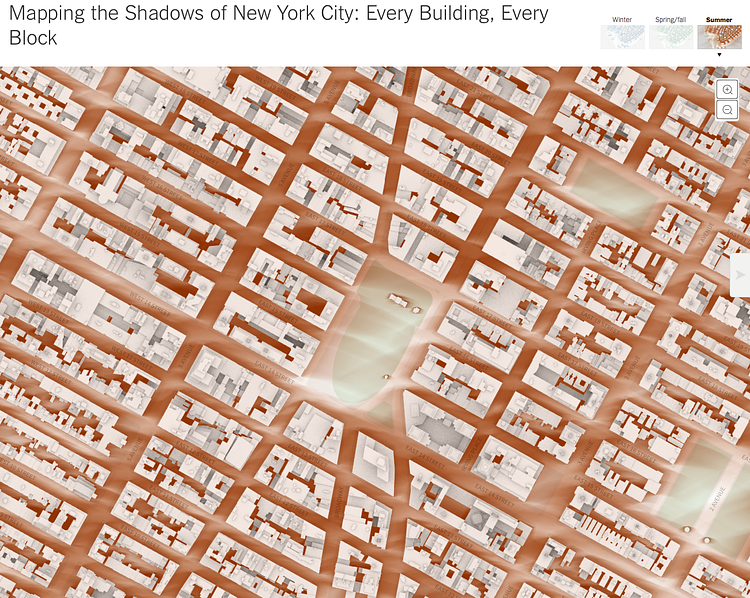


The New York Times recently published a fantastic interactive map to accompany an article titled Mapping the Shadows of New York City: Every Building, Every Block in which they used public building height data from the City to create a street map of New York City's literal shady spots.
You’re looking at a map of all of the shadows produced by thousands of buildings in New York City over the course of one day. This inverted view tells the story of the city’s skyline at the ground level.
Explore the full map to interact with the shadow data.
via New York Times

Matt Coneybeare
Editor in Chief
Matt enjoys exploring the City's with his partner and son. He is an avid marathon runner, and spends most of his time eating, running, and working on cool stuff.
Something wrong with this post? Let us know!


