Photo:
Data Is Beautiful
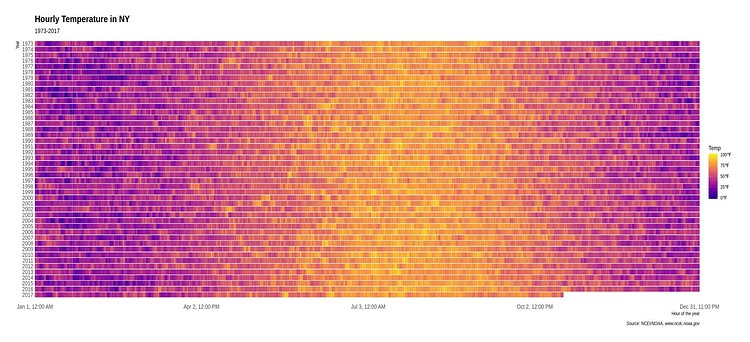
Using data from weather station "USAF 725030", a.k.a. La Guardia Airport, redditor and data visualization creator MrYeedle recently put together this colorful heatmap showing the temperature in New York City hourly since 1973 in order "to show how weather (granular data) is different than climate (aggregate data) and why you shouldn't confuse the two." Check out the high definition version of the data visualization to see it in more detail.

Matt Coneybeare
Editor in Chief
Matt enjoys exploring the City's with his partner and son. He is an avid marathon runner, and spends most of his time eating, running, and working on cool stuff.
Something wrong with this post? Let us know!


