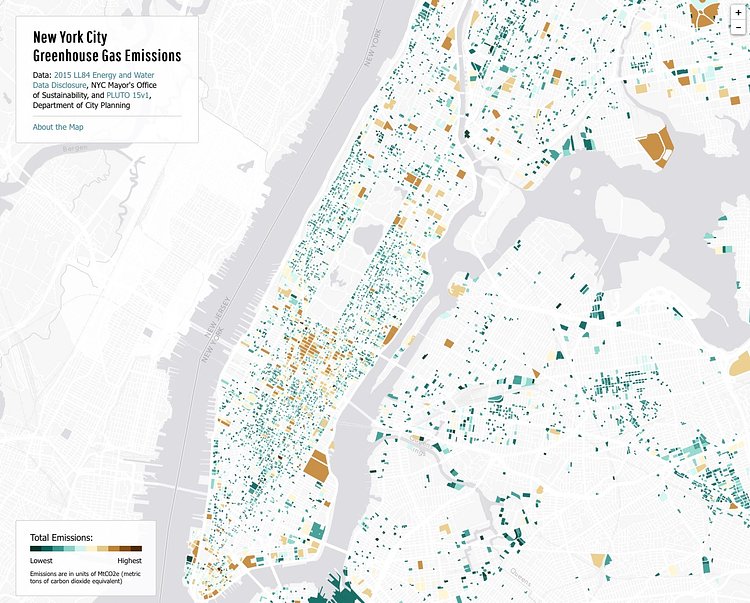
A new interactive map from Brooklyn-based web developer and data visualization guru Jill Hubley uses publicly accessible data to show which buildings around the City have the highest and lowest greenhouse gas emissions.
Looking at the map, it's obvious that high emissions are being generated by a cluster of buildings in Midtown Manhattan, which is not surprising, given the size and type of buildings in that neighborhood. The main call to action in PlaNYC is to improve the energy efficiency of NYC's buildings2, and one initiative that facilitates that action is The New York City Carbon Challenge. The challenge loops in private sector partners who have volunteered to agressively cut their emissions. These partners include office buildings, Broadway theaters, and hotels — including many in Midtown.
Read through the full analysis or check out the interactive map to see if the building where you live or work is one of the worst offenders.
via Jill Hubley

Matt Coneybeare
Editor in Chief
Matt enjoys exploring the City's with his partner and son. He is an avid marathon runner, and spends most of his time eating, running, and working on cool stuff.
Something wrong with this post? Let us know!


