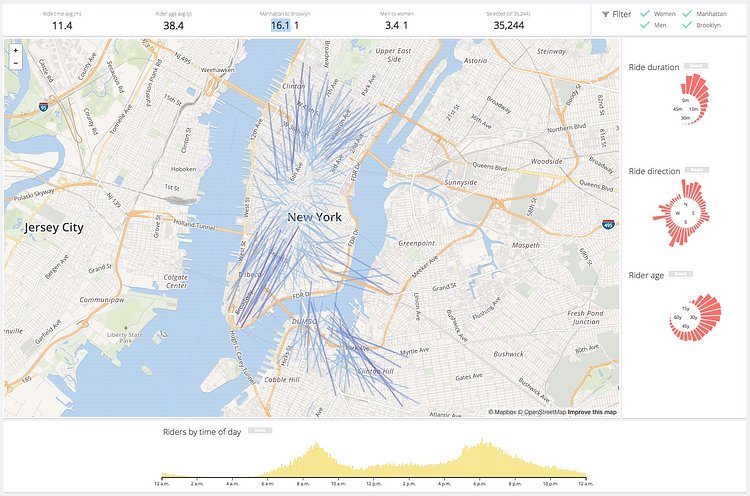
Sam Petula, a data visualization editor at MSNBC recently created a side-project called Citi Bike Explorer that maps out the ride data from the services busiest day ever, July 17th, 2014, in order to find riding trends across gender, age, trip direction and duration. While this tool is an interesting example of the data from that specific day, you could download the open-source code that runs the site, download a new day's data-set from Citi Bike's system data page, coerce the data into a format recognized by the site, and swap out the data-sets for that new data set.
Easy right? Perhaps we as a City could ask Petula to make it a bit easier to change the dates, because this visualization site is fantastic.
via reddit

Matt Coneybeare
Editor in Chief
Matt enjoys exploring the City's with his partner and son. He is an avid marathon runner, and spends most of his time eating, running, and working on cool stuff.
Something wrong with this post? Let us know!


