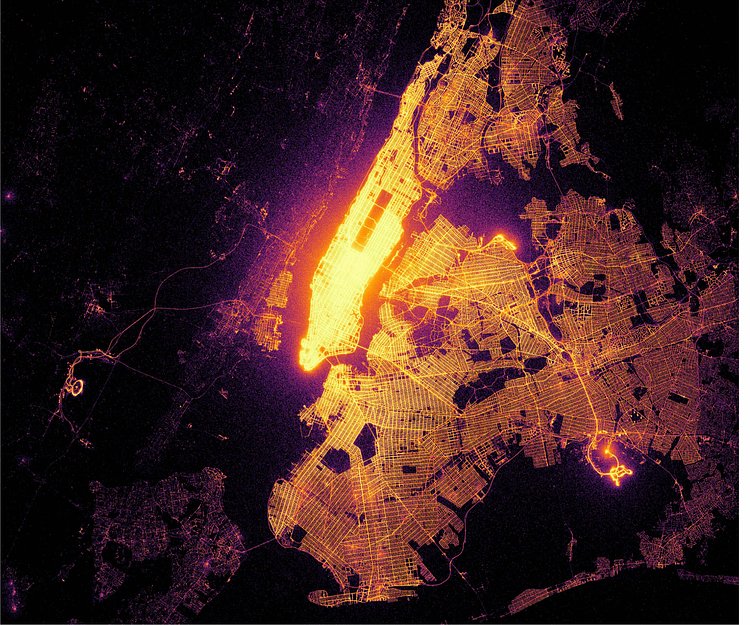
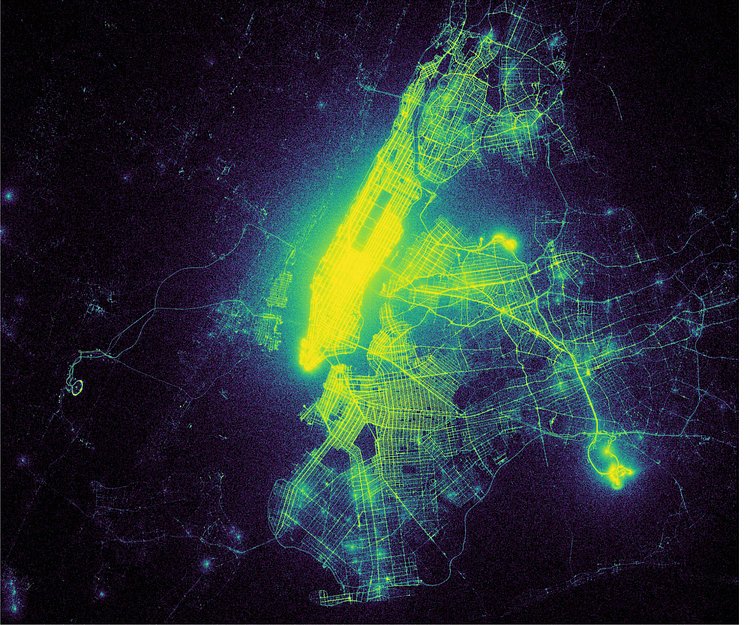
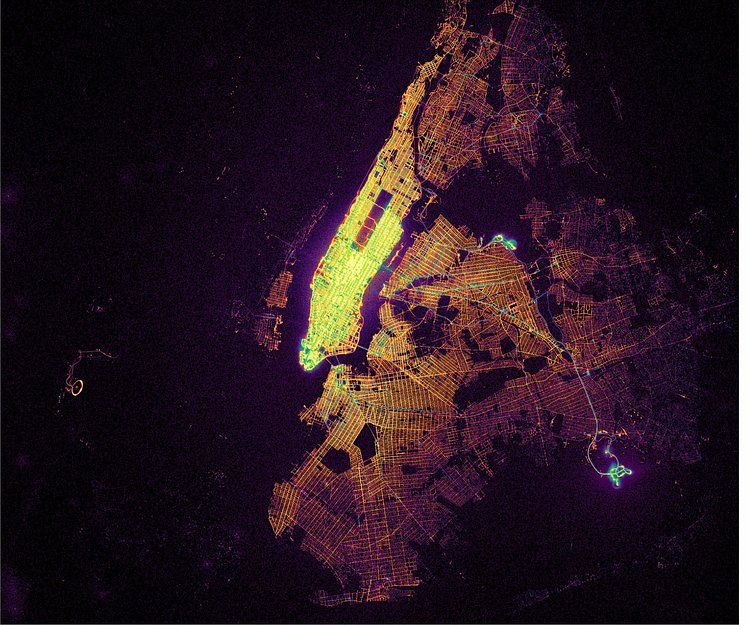


Geophysicist and aspiring data scientist Ravi Shekhar recently plotted out pickup and dropoff location data from the NYC Taxi and Limousine Commission (TLC) that covered the past 7 years in New York City. Plotting each location as bright as a firefly, the accumulation of millions of data points light up the City's most popular spots for hailing a cab, as well as the most popular trip destinations.
So I was curious, where do taxis pick up passengers, or more precisely, what does the distribution of taxi pickup locations look like? With 1.3 billion taxi pickups, plotting the distribution in a way that does not wash out detail is very challenging.
Check out the accompanying post to see how Shekhar created the colorful maps from billions of data points.