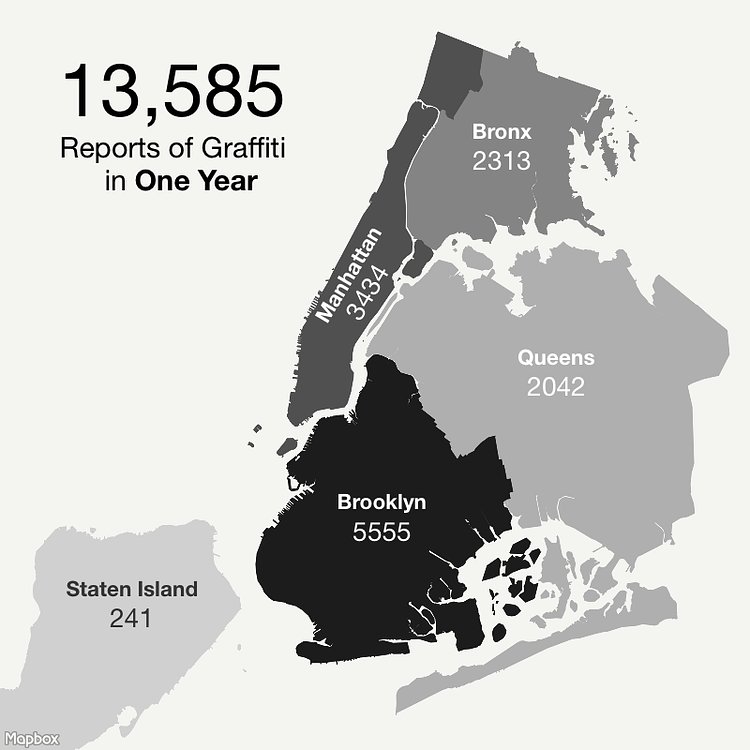


Brooklyn-based data visualization enthusiast Nicholas Reyland recently scoured the New York City open data portal entries on graffiti reporting and cleanup response times to create these 3 maps showing the state of graffiti in each NYC neighborhood.
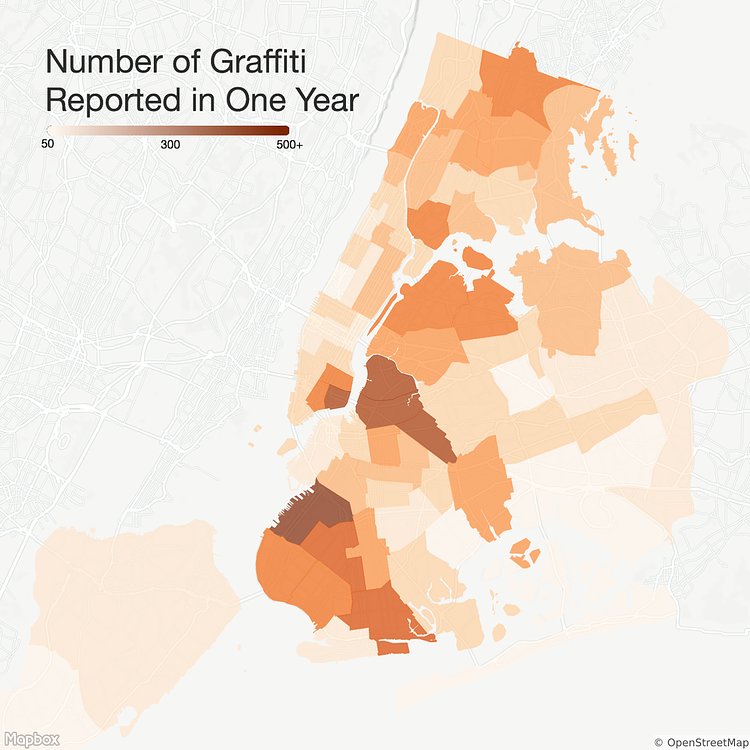
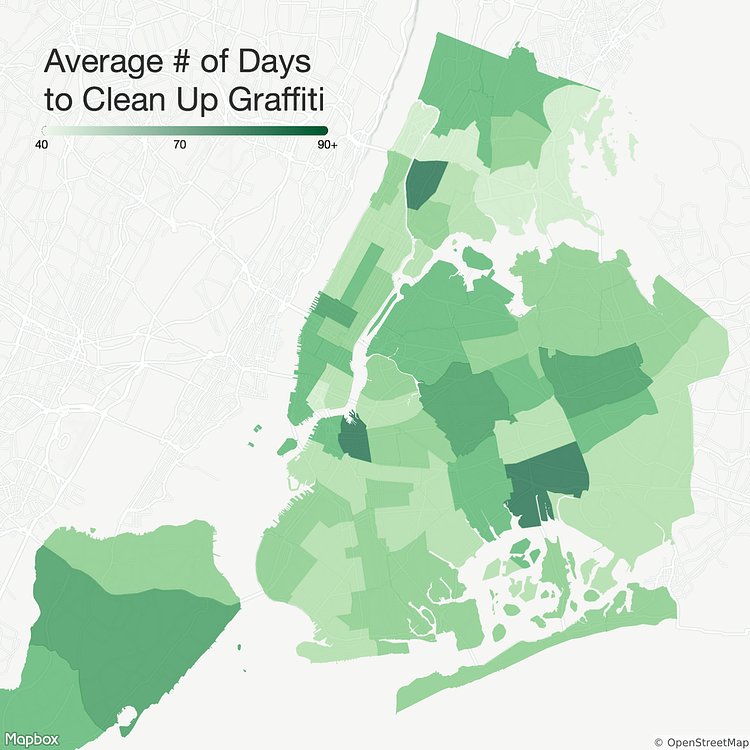
I took NYC's open data and created 2 info graphics to show the number of graffiti reported by borough and police precinct. The 3rd graphic shows the average time it takes to clean up a reported piece of graffiti.
via r/nyc

Matt Coneybeare
Editor in Chief
Matt enjoys exploring the City's with his partner and son. He is an avid marathon runner, and spends most of his time eating, running, and working on cool stuff.
Something wrong with this post? Let us know!


