
This pizza tastes like a million bucks, but it can be yours for $20. Chef Pasquale Cozzolino, of Ribalta in Greenwich Village, created a pie made with caviar, glimmering gold dust and black truffles after hearing a similar one was being hawked at Industry Kitchen in the Financial District for $2,000.
2nd Avenue Subway Dining Guide; Secrets of Central Parks Winterization Routine; De Blasio as the Anti-Trump?
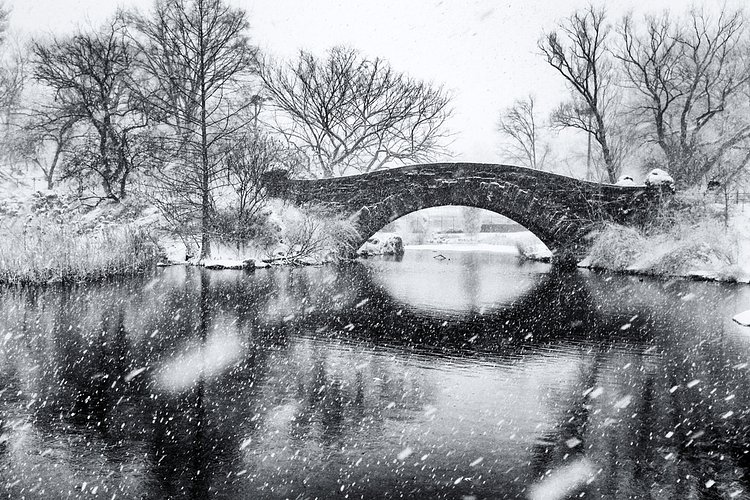
Photo:
[ raymond ]
There is a lot of stuff going on the City, and we can't write about it all. Here are some interesting things some of our friends have written up lately.
- 6sqft ⇒ Norman Foster's 50 Hudson Yards Will Be City's Most Expensive Office Building at $4B
- Bowery Boogie ⇒ The Pickle Guys Are Opening a Fried Pickles (And Burger) Joint Next Door
- Brooklyn Magazine ⇒ Alphabet Soup: An a to Z Guide to Brooklyn's Best Bowls
- Bushwick Daily ⇒ Comic: Phrase 'In a Warehouse in Bushwick' Is Now Mainstream
- Curbed NY ⇒ Here's What It Looked Like to Rally for the Second Avenue Subway in 1923
- Daytonian in Manhattan ⇒ The Lost 71st Regiment Armory -- Park Avenue and 33rd Street
- East Village Today ⇒ Petrus Stuyvesant's Pear Tree
- Gothamist ⇒ A Guide to the Best Places to Eat & Drink Off Each New Second Avenue Subway Stop
- Guest of a Guest ⇒ This Year's New Big Dessert Trend Is...Unicorns?
- Long Island City Post ⇒ Hunters Point Library to Open Toward the End of Summer
- Metro ⇒ New York Public Library's #Readersunite Initiative Links Book Lovers All Over the Globe
- Motherboard ⇒ The Humans and Machines That Built New York’s Most Expensive Subway
- New York Times ⇒ A New Sandwich Shop for Union Square
- Staten Island Advance ⇒ Watch: Nordstrom Rack and Nike Factory Store Take Shape
- The Nation ⇒ Can New York City Mayor Bill De Blasio Be the Anti-Trump?
- Thrillist ⇒ New York City's 100 Most Important Foods
- Unionsquareblog ⇒ New in 2017 (Plus, the Best of 2016 You Can Still Catch) in Union Square
- Untapped Cities ⇒ Cities 101: The Secrets of Central Park’s Winter Routine
- Welcome2TheBronx ⇒ New York Times Lists South Bronx as One of 52 Places in the World to Visit in 2017
Heat Map Shows Average SAT Scores Across New York City Neighborhoods
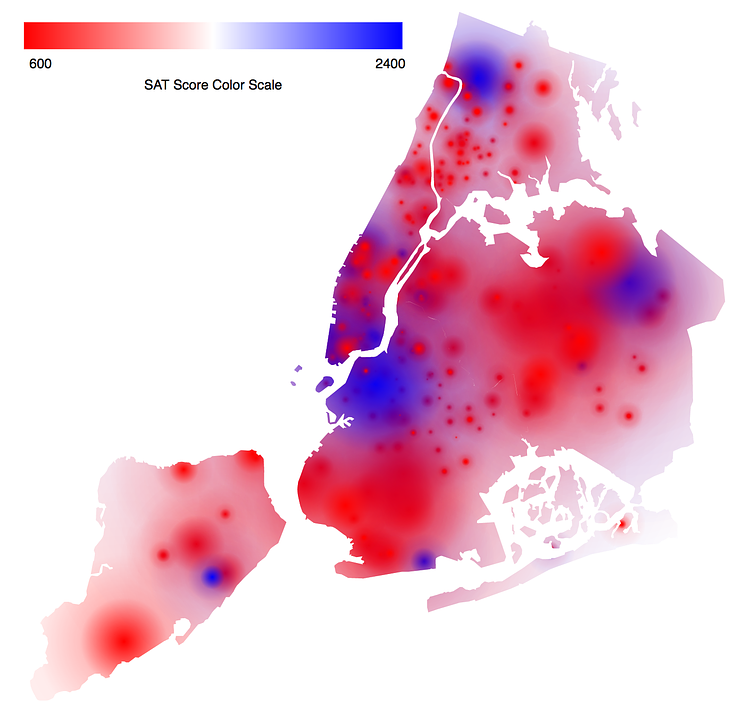
Photo:
Nicholas Usoff
Software engineer Nicholas Usoff recently compiled SAT test data from each NYC High School and plotted them out on a heat map of the City. According to Usoff on reddit:
Visualization built using D3.js, data came from the Department of Education of New York. Each school with SAT data is assigned a circle with a radius corresponding to the number of students who took the SAT, and a color associated with the average SAT score for those students.
From the heat map you can pinpoint the spots where our City's best schools (Stuyvesant, Brooklyn Tech,
Staten Island Tech, etc…) bring up their neighborhood averages.