Viewing NYC on Instagram, April 11th, 2018 at 12:57 PM

Flatiron Building, New York, New York. Photo via @melliekr #viewingnyc #newyork #newyorkcity #nyc #flatironbuilding
Photo: @viewingnyc

Follow our Instagram account @ViewingNYC to see photos of New York City from some of the best local, amateur, and professional photographers around! If you would like to see your photo featured, be sure to use hashtag #viewingnyc and we'll take a look!

If you want more than just photos, check out @ViewingNYC on Twitter, and Viewing NYC on Facebook to also get a stream of our best articles.

Subway Etiquette Tip #41: Please Don't Defecate Directly on the Subway Tracks [NSFW]

Photo: Imgur

You would think that some of our Subway Etiquette Tips would go without saying. Like this guy at the 51st Street E Train station… perhaps he didn't know that taking a literal shit off the subway platform onto the train tracks was an unforgivable social gaffe? As such, it is our duty to provide you with Subway Etiquette Tip #41: Please don't defecate on the New York City subway. Thank you.

The New Yorker's Interactive Maps Show Income Inequality Along New York City Subway Lines

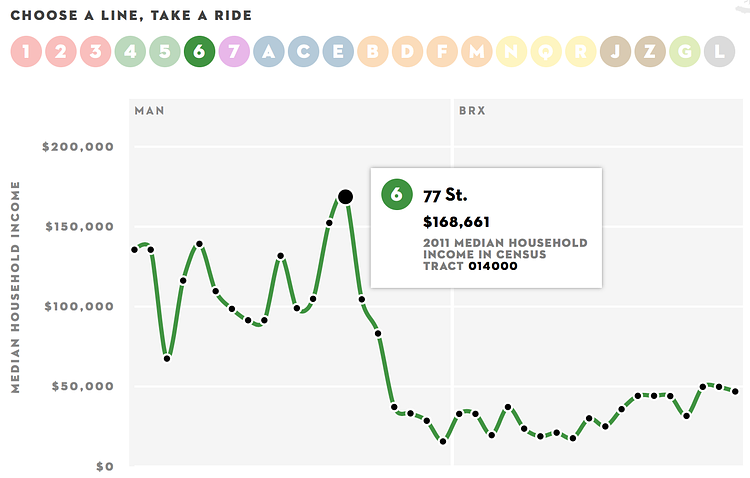
Income Inequality and New York's Subway (screenshot)

Inequality and New York's Subway is an interactive project from The New Yorker that plots out the median income levels, using U.S. Census Bureau data, of the areas surrounding each subway stop, along a line of the subway itself. The resulting graph shows how the income levels change as you progress through the stops on any subway line. While the accompanying article is from 2013, and the City's income inequality has exacerbated in the years since, it is still a pretty accurate representation of the income inequality across the subway lines.

New York City has a problem with income inequality. And it’s getting worse—the top of the spectrum is gaining and the bottom is losing. Along individual subway lines, earnings range from poverty to considerable wealth. The interactive infographic here charts these shifts, using data on median household income, from the U.S. Census Bureau, for census tracts with subway stations.