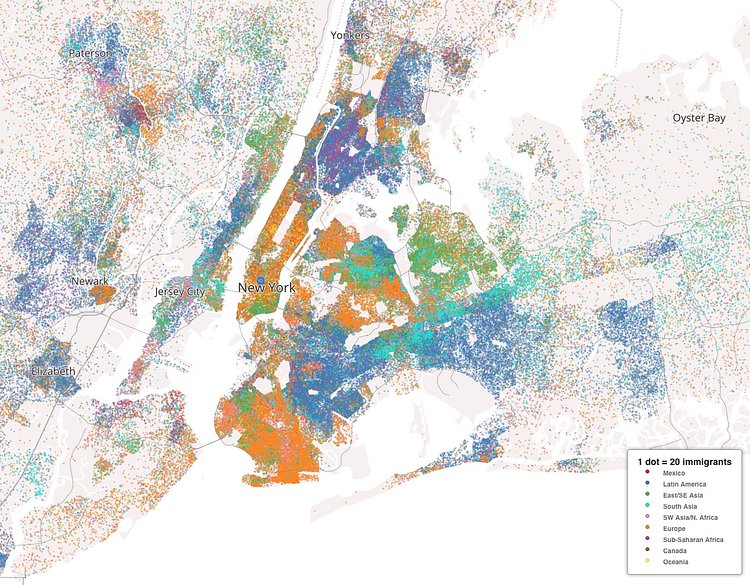
Assistant professor of geography at Texas Christian University Kyle Walker recently compiled census tract data on immigrant origin countries to produce this colorful interactive map showing the cultural fabric of the City.
Using census tract data, Walker represents the concentration of America’s immigrant population as dots, colored according to their country of origin […] What results is a unique mix of colors—an immigrant fingerprint of each city, showing where its immigrant residents are from and where they currently live.
The full map includes data and dots for the entire country, so take a peek at New York City and compare/contrast against other major cities across the United States.
via Citylab

Matt Coneybeare
Editor in Chief
Matt enjoys exploring the City's with his partner and son. He is an avid marathon runner, and spends most of his time eating, running, and working on cool stuff.
Something wrong with this post? Let us know!


