Photo:
@Crimealytics
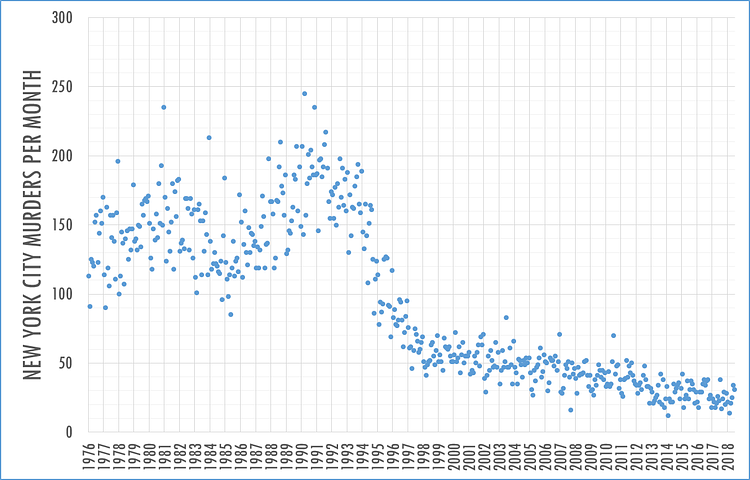
Using the FBI's Supplementary Homicide Reports for monthly counts until 2016, and New York City's open data portal for 2017 and 2018, analyst Jeff Asher recently created this graph showing the steady decline of the City's murder rate since its peak in 1990.
New York City murders per month, 1976 to June 2018. The city had an insane 245 murders in March 1990 which is just 45 below last year's entire murder count there.
via Twitter

Matt Coneybeare
Editor in Chief
Matt enjoys exploring the City's with his partner and son. He is an avid marathon runner, and spends most of his time eating, running, and working on cool stuff.
Something wrong with this post? Let us know!


